Examples of visualizations in non-digital prosopography projects
Diagrams like these are used regularly by humanists and fulfill an important function in supporting a narrative. However, they are also incredibly static, do not reflect the uncertainty factors in disambiguating namesakes and do not allow any adjustment or "what-if" scenarios.
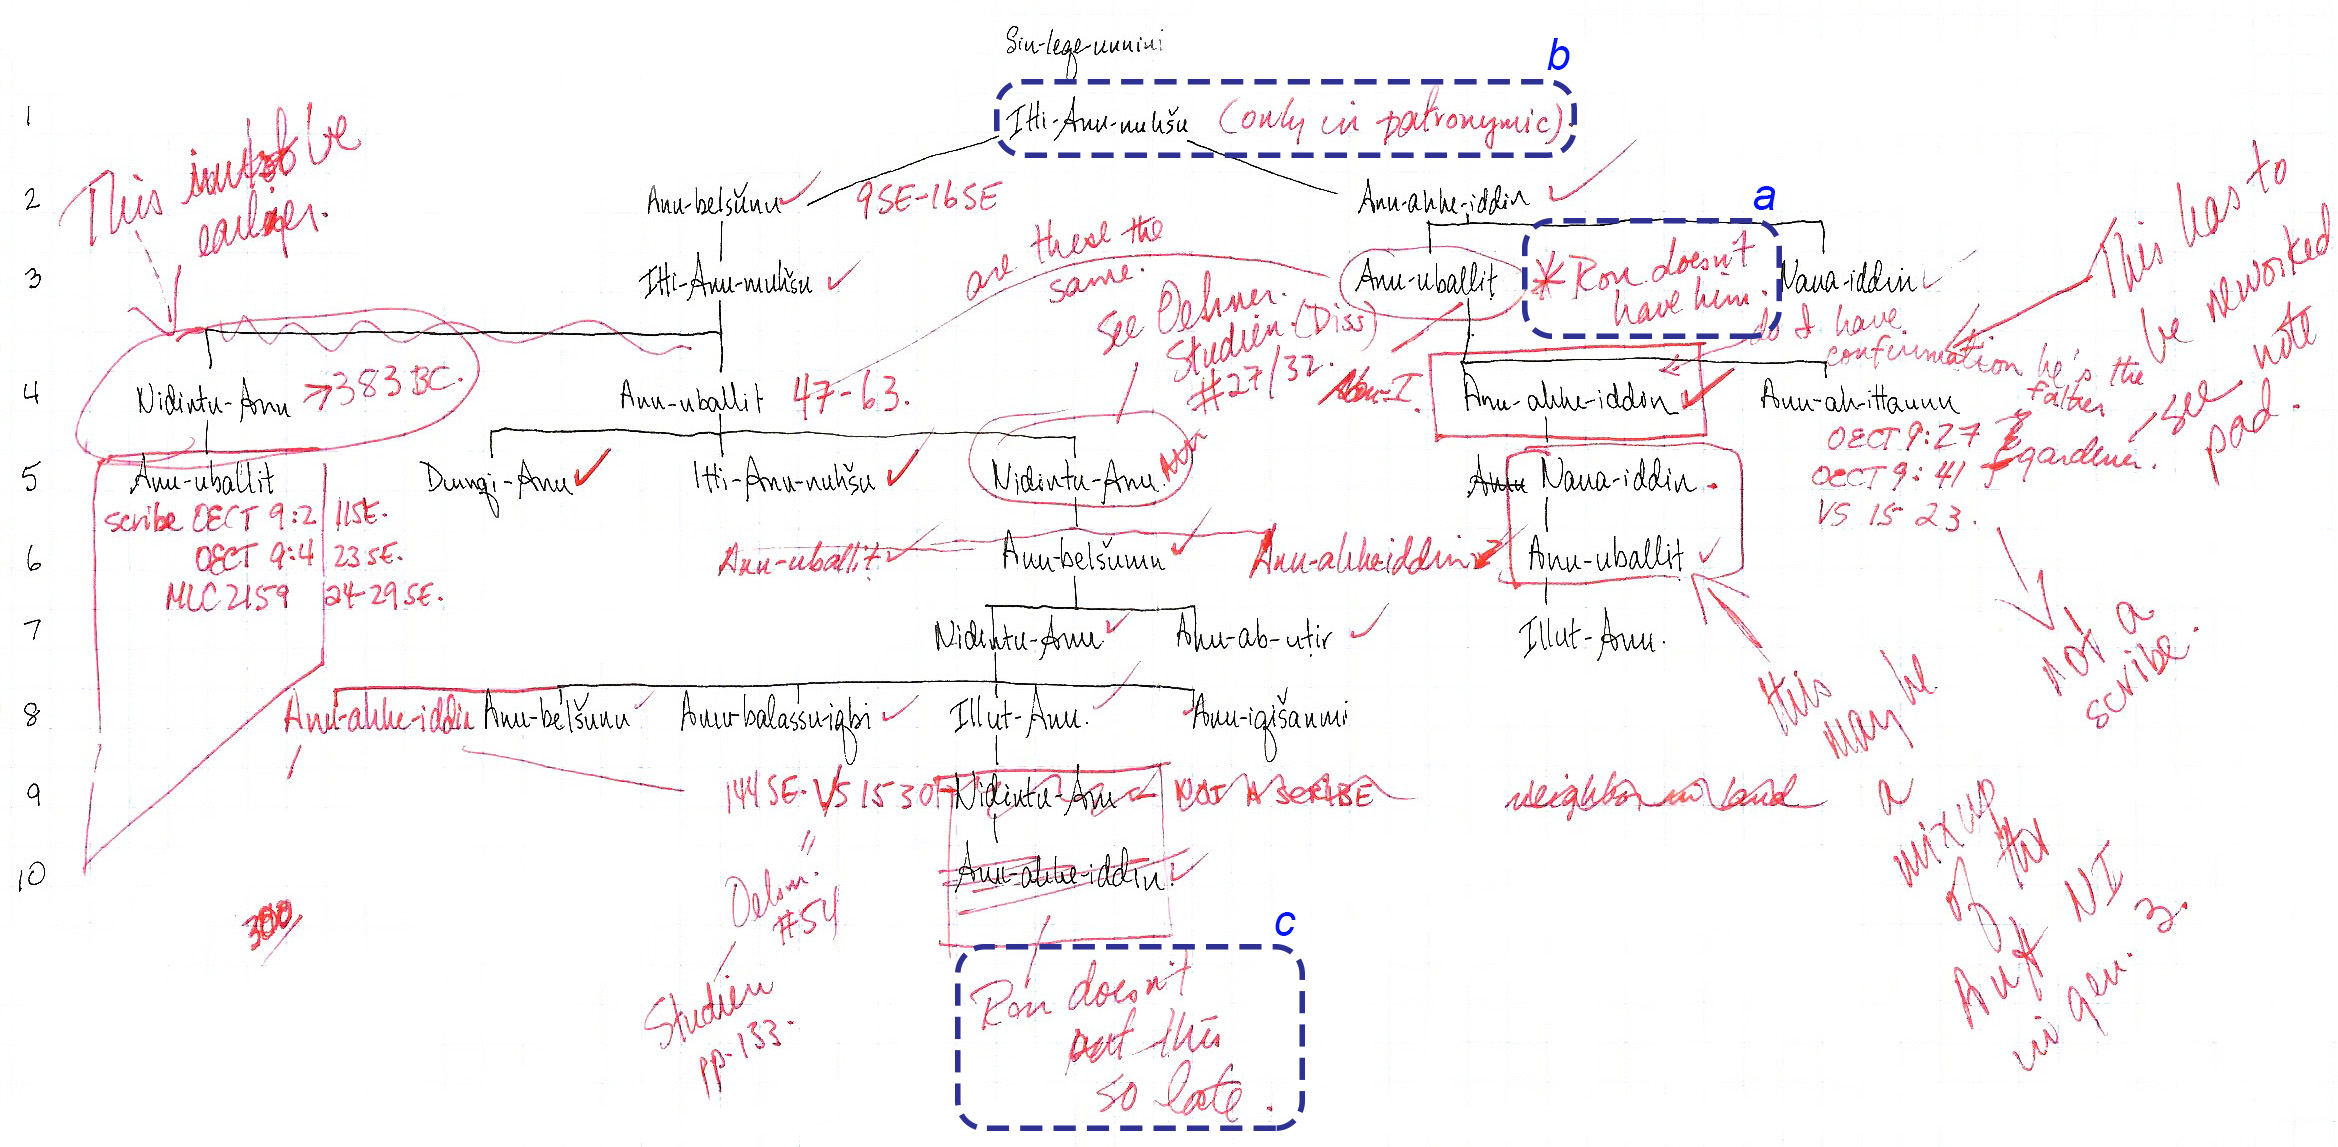
Figure A: Hand-written Family Tree (a: “Ron doesn’t have him”; b: “only in patronymic”; c: “Ron doesn’t put this so late”)
Figure A shows a typical hand-written visualization of a family tree, including notes that reflect differences in versions or interpretation among researchers.
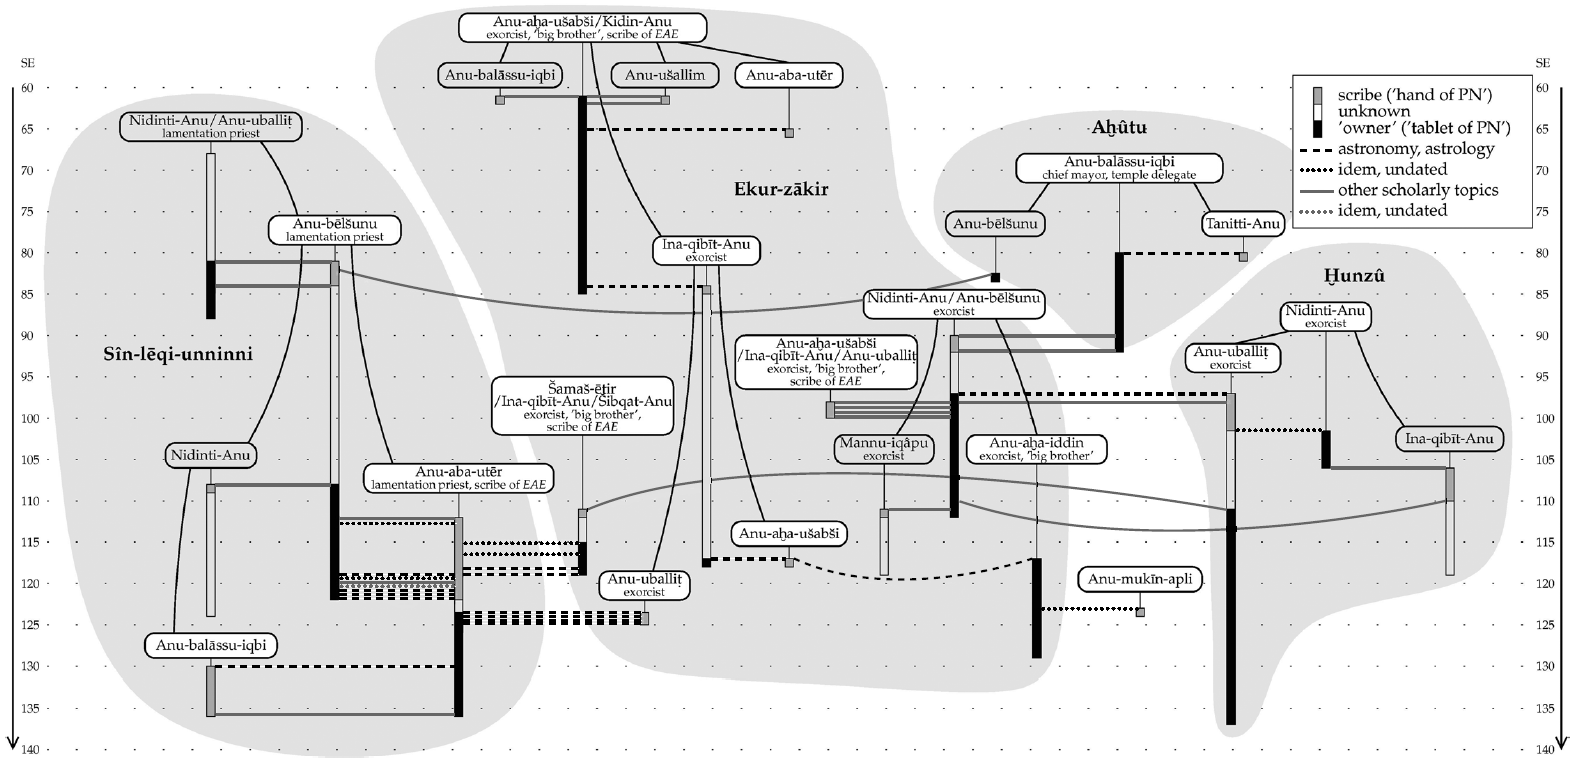
Figure B. Printed diagram of network relations
The diagram in Figure B illustrates that teacher-student relations in Hellenistic Uruk crisscross family lines. Many of the individuals depicted in Figure B also appear in Figure A. However, in the print form it is impossible to explore the connections between these two views. From: M. Ossendrijver, "Science in Action: Networks in Babylonian Astronomy." Pp. 213-221 in Babylon: Wissenskultur in Orient und Okzident, eds. E. Christiane Cancik-Kirschbaum, et al. Berlin: 2011.