BPS Architecture Diagram
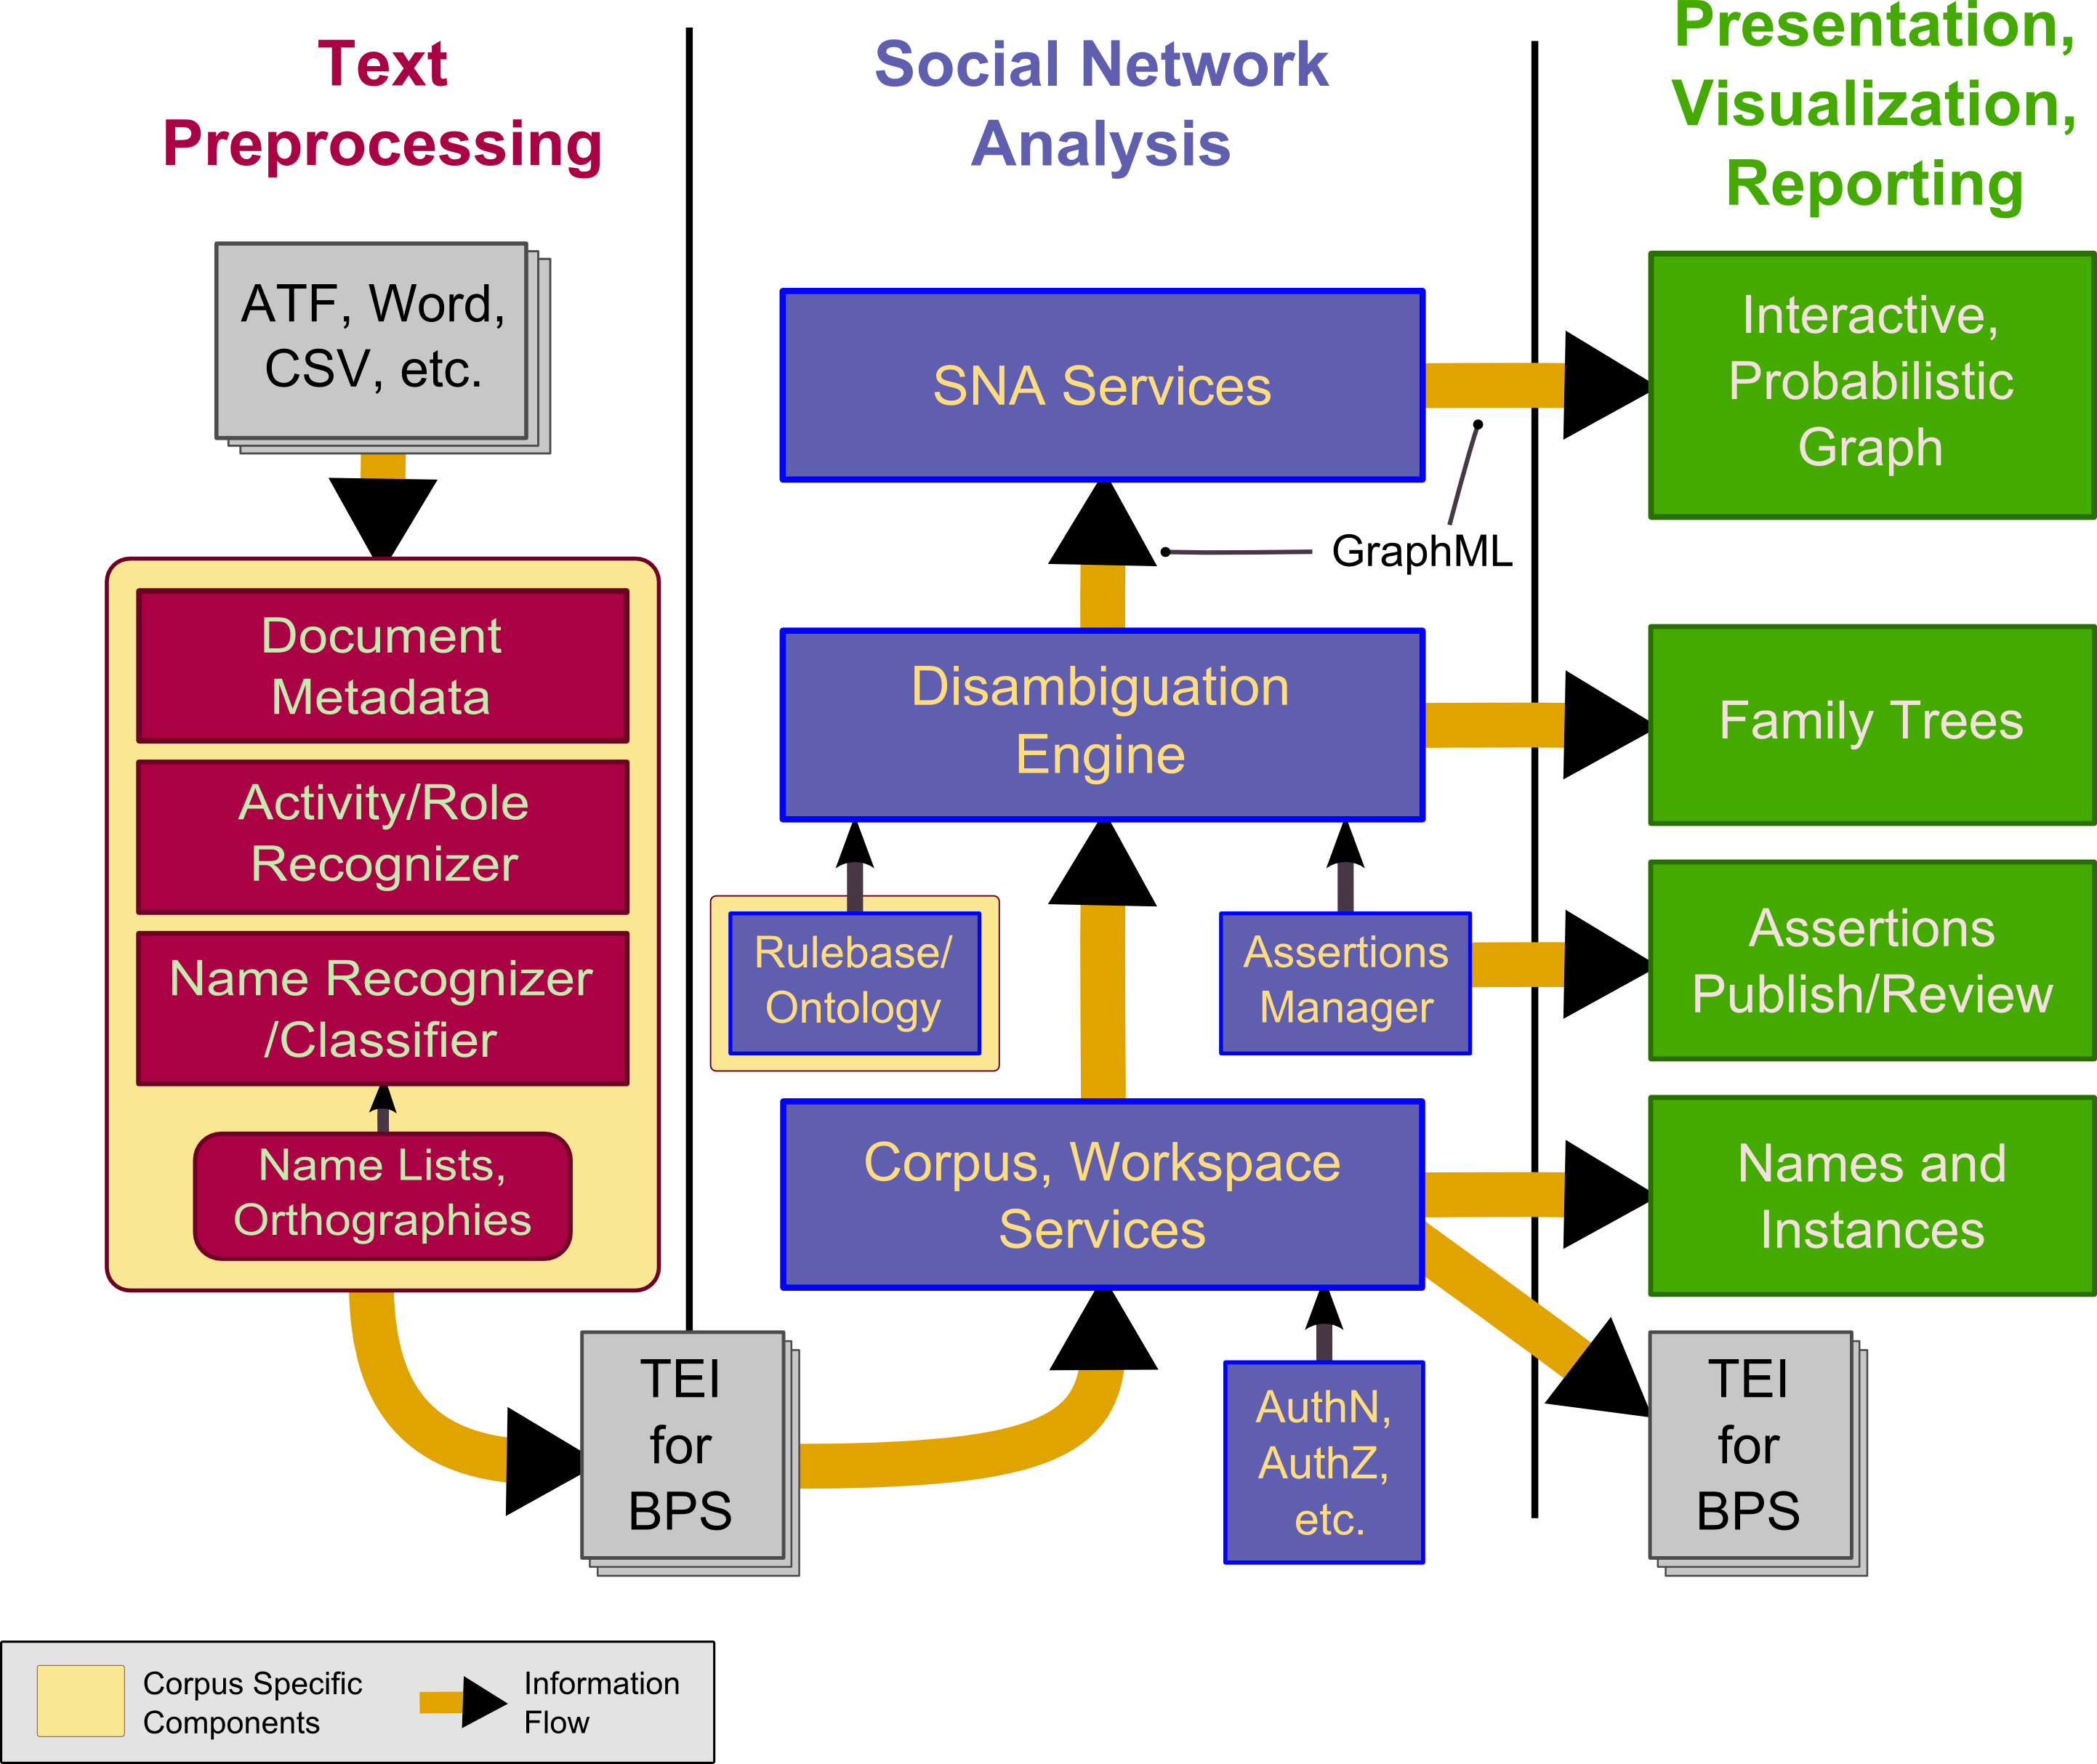
Figure C. BPS Architecture diagram
This diagram presents the major components of the BPS system, and the way that information flows through the system. The three primary sections are depicted in three vertical columns, with the major information flows represented as yellow arrows between the components.
The first column, in red, shows text processing steps, in which a corpus is converted from some native format to TEI that includes elements denoting the individual documents, activities within each document, and persons that have roles in those activities. This markup may be generated by hand, or by some semi-automated processes to recognize names, filiation, roles and activities. Because each domain has different language models, many of the components in the text processing section have corpus- (or domain-) specific aspects to them.
In the second major section, in blue, TEI is uploaded and parsed by the corpus services, and a native data model is built internally. The workspace services share this model, and leverage authentication (AuthN) and authorization (AuthZ) components to support login and access controls on corpus and workspace resources. The disambiguation engine incorporates rules that may be generic or may be corpus-specific, and associates the name citations in each document with actual persons depicted in the texts. It includes support for assertions that researchers make to confirm or reject the possibilities suggested by the engine. Finally, GraphML (a standard XML format) is sent to the SNA services to compute significant features of the social networks. While the basic pieces are in place for all these components, this phase of the project will generalize and extend a number of these components.
The last section, in green, shows the presentation/visualization of results from various core model and analysis components, including the declared data model in each corpus (names, activities, etc.), assertions that the researcher has made or imported from others, family tree visualizations, as well as interactive network graphs for exploration and understanding. A workspace model will also be exportable as TEI (this may require some extensions).